“One has no right, under pretext of freeing yourself, to be illogical
and incoherent by getting rid of structure.”
– Thelonious Monk
This chapter is a natural extension of music listening as described in chapter 3. The goal is to extract higher-level musical structures from the low-level musical metadata already derived from the audio. Therefore, the work here implies using more pattern-recognition techniques [42] than signal processing. With perception in particular, pattern recognition has much to do with similarity, as we are dealing with “interpreted” signals—there is no absolute truth or consensus on how to organize audio signals. Musical similarity though, remains to be defined properly [81].
Measuring similarities in music audio is a particularly ambiguous task that has not been adequately addressed. The first reason why this problem is difficult is simply because there is a great variety of criteria (both objective and subjective) that listeners must consider and evaluate simultaneously, e.g., genre, artist, instrument, tempo, melody, rhythm, timbre. Figure 4-1 depicts this problem in the visual domain, with at least two obvious classes of similarities that can be considered: outline and texture.
Another major difficulty comes from the scale at which the similarity is estimated. Indeed, measuring the similarity of sound segments or entire records raises different questions. Previous works have typically focused on one single task, for instance: instruments [111], rhythmic patterns [46], or entire songs [6]. Our approach, on the other hand, is an attempt at analyzing multiple levels of musically meaningful similarities, in a uniform fashion.
Recent original methods of mapping music into a subjective semantic space for measuring the similarity of songs and artists have been proposed [11]. These methods rely on statistical models of labeled signals—for example, acquired through web-crawling and natural language processing (NLP)—which do not easily scale down in measuring similarities within songs. Here, we are only concerned with “objective” acoustic criteria (or musical dimensions) measurable directly from the signal with no prior knowledge, such as the ones extracted through music listening: pitch, rhythm, and timbre. The analysis task is challenging for the following reasons:
1. non-orthogonality of the musical dimensions; and
2. hierarchical dependency of the various scales of analysis.
“Non-orthogonality” because the pitch, loudness and timbre percepts depend on a shared underlying signal structure. “Hierarchical” because the sensation of tatum, tempo, or pattern all depend on the lowest-level segment structure. We believe that a multi-scale and multi-class approach to acoustic similarities is a step forward towards a more generalized model.
Hierarchical representations of pitch and rhythm have already been proposed by Lerdahl and Jackendoff in the form of a musical grammar based on Chomskian linguistics [100]. Although a questionable oversimplification of music, among other rules their theory includes the metrical structure, as in our representation. However, in addition to pitch and rhythm, we introduce the notion of hierarchical timbre structure, a perceptually grounded description of music audio based on the metrical organization of its timbral surface: the perceived spectral shape in time, as described in section 3.3.
Global timbre analysis has received much attention in recent years as a means to measure the similarity of songs [11][6][69]. Typically, the estimation is built upon a pattern-recognition architecture. The algorithm aims at capturing the overall timbre distance between songs, given a large set of short audio frames, a small set of acoustic features, a statistical model of their distribution, and a distance function. It was shown, however, by Aucouturier and Pachet, that these generic approaches quickly lead to a “glass ceiling,” at about 65% R-precision [7]. They conclude that substantial improvements would most likely rely on a “deeper understanding of the cognitive processes underlying the perception of complex polyphonic timbres, and the assessment of their similarity.”
It is indeed unclear how humans perceive the superposition of sounds, or what “global” means, and how much it is actually more significant than “local” similarities. Comparing most salient segments, or patterns in songs, may perhaps lead to more meaningful strategies.
A similarity analysis of rhythmic patterns is proposed by Paulus and Klapuri [130]. Their method, only tested with drum sounds, consists of aligning tempo-variant patterns via dynamic time warping (DTW), and comparing their normalized spectral centroid, weighted with the log-energy of the signal. It is pointed out that aligning patterns turns out to be the most difficult task.
Ellis and Arroyo [46] present an approach to rhythm similarity called “eigenrhythm” using Principle Component Analysis (PCA) of MIDI drum patterns from 100 popular songs. First, the length and downbeat of input patterns are estimated via autocorrelation and by alignment to an average “reference” pattern. Finally, through PCA analysis, they reduce the high-dimensionality data to a small space of combined “basis” patterns that can be used for classification and visualization.
In [129], Parry and Essa extend the notion of rhythmic elaboration to audio, first proposed by Tanguiane [158] for symbolic music. They divide the amplitude envelope via beat tracking, and measure the pattern length as in [130]. This method stands out for its ability to estimate the complexity of transitioning between intra- or inter-song patterns.
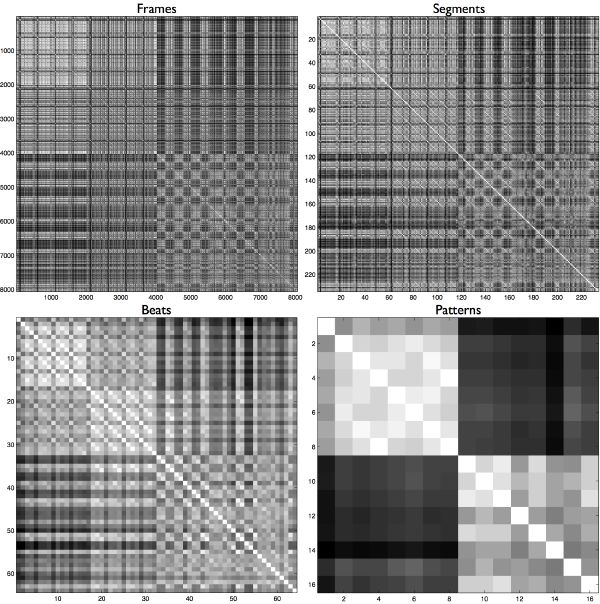
In 2001, Foote and Cooper [52] were first to introduce self-similarities as a way to visualize musical structures. The method consists of building a square matrix where time runs from left to right, as well as from top to bottom. Cells {ti,tj} of the matrix represent the audio similarity at time ti and tj in the waveform. Typically the distance measure is symmetric (i.e., dist(ti,tj) = dist(tj,ti)), thus the matrix is symmetric, and the diagonal is null as shown for the example in Figure 4-7.
Foote and Cooper propose the cosine distance between Mel-Frequency Cepstral-Coefficient (MFCC1) feature vectors. They suggest that “psychoacoustically motivated parameterizations [...] may be especially appropriate if they match the similarity judgments of human listeners.” From their matrix can be derived a representation of the rhythmic structure that they call beat spectrum. In [30], they propose a statistically based framework for segmenting and clustering larger audio segments via Singular Value Decomposition (SVD). The analysis can, for instance, return the structural summarization of a piece by recognizing its “most representative” sections, such as chorus and verse.
Peeters et al. also propose to summarize songs by detecting occurrences of large sections in self-similarity matrices [132]. Their approach stands out for introducing dynamic features, which model the temporal evolution of the spectral shape over a fixed duration of time. Interestingly, they consider various scales of analysis (up to 1Hz), and employ an unsupervised grouping strategy of successive states, through K-means and a hidden Markov model (HMM). In a first pass, states are defined as templates, by segmenting the matrix.
Our approach starts with a series of significant segmentations, naturally derived from perceptual models of listening, and hierarchically organized. Our similarity matrices differ from others in the nature of the audio representation, and in how we derive larger segment similarities (i.e., sound, beat, pattern). The standard approach usually consists of 1) computing a fine-grain matrix of “generic” similarities, through short windows of fixed duration, and 2) segmenting the matrix at a given scale by detecting sequence repetitions (upper/lower diagonals). Instead, we first compute meaningful segmentations of “specific” perceptual characteristics (i.e., pitch, rhythm, timbre), and only then compute their similarity matrices. Our benefits are:
1. multiple representations for more specific applications;
2. segment boundaries accurately preserved; and
3. independence to time (tempo) variations.
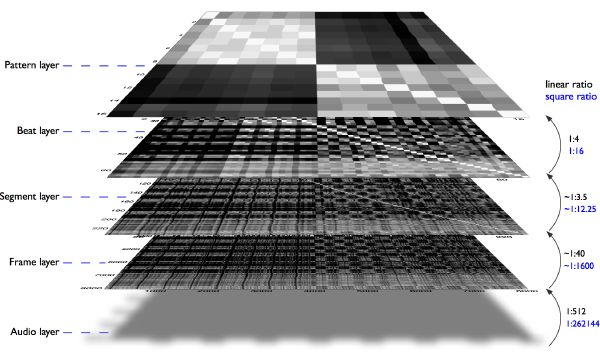
In a sense, our segmented and synchronous matrices (i.e., segment, beat, pattern), which are orders of magnitude smaller than usual frame-based matrices (Figure 4-2), are graphical artifacts of intermediate structure-analysis results, rather than an algorithmic starting point, as is usually the case. We are not particularly concerned with extracting very large structures from the lowest-level matrices directly. Nonetheless, these algorithms still apply at higher levels, where the typical O(N2) computation cost might originally be a limitation with standard frame-based representations.
Our hierarchical representation is recursively computed using dynamic programming (section 4.3), which itself is a recursive algorithm. We use larger matrices (lower-level) to infer the smaller ones (higher-level), such that the pattern-synchronous self-similarity matrices (our smallest) are computed via dynamic programming from the beat-synchronous self similarity matrices, which themselves are computed from the segment-synchronous self-similarity matrices, which are found via dynamic programming at the frame scale.
|
|
“If you don’t do the best with what you have happened to have got,
you will never do the best with what you should have had.”
– Rutherford Aris
Dynamic programming2 (DP) is a method for solving dynamic (i.e., with time structure) optimization problems using recursion. It is typically used for text processing and alignment and similarity of biological sequences, such as protein or DNA sequences. First, a distance function determines the similarity of items between sequences (e.g., 0 or 1 if items match or not). Then, an edit cost penalizes alignment changes in the sequence (e.g., deletion, insertion, substitution). Finally, the total accumulated cost is a measure of dissimilarity.
A particular application of DP is known as dynamic time warping (DTW) [33]. The concept of dynamic time alignment has been applied to solve the problems associated with spectral sequence comparison of speech in automated speech recognition (ASR) systems [72].
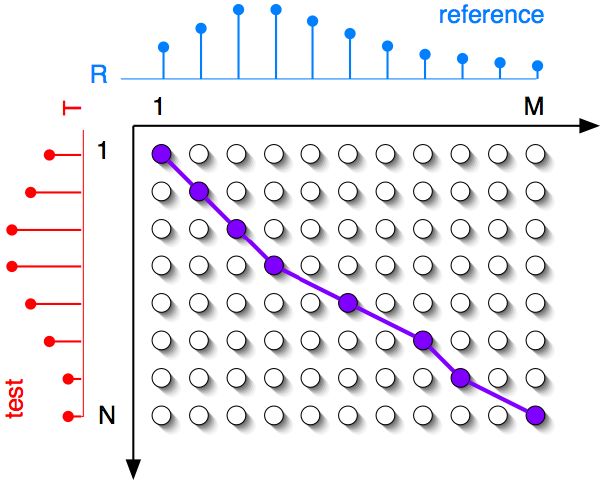
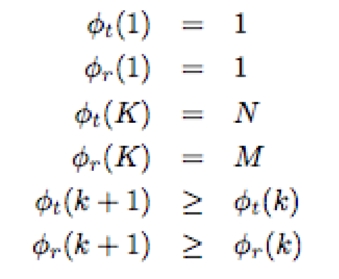
The principle illustrated in Figure 4-3 is the following: given a test pattern T = {t1,...,tN} and a reference pattern R = {r1,...,rM}, a particular point-to-point mapping φ = (φt,φr) of length Kφ time aligns T and R.
|
| (4.1) |
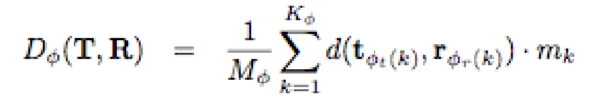
The optimal alignment minimizes the overall distortion D(T,R), where D(T,R) is based on a sum of local distances between elements, i.e., d(ti,rj), where d is a distance defined as Euclidean, Cosine, Mahalanobis, Manhattan, Minkowski, etc., and ti, rj are specific feature vectors. The recursive algorithm incrementally evaluates all possible paths to the desired endpoint {tN,rM}. Once the endpoint is reached, the optimal path can be determined by backtracking through the minimum cost function:
with the following endpoint, and monotonicity constraints,
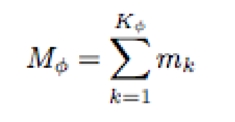
Mφ is a path normalization factor that allows to compare between different warps, e.g., with different lengths:
| (4.4) |
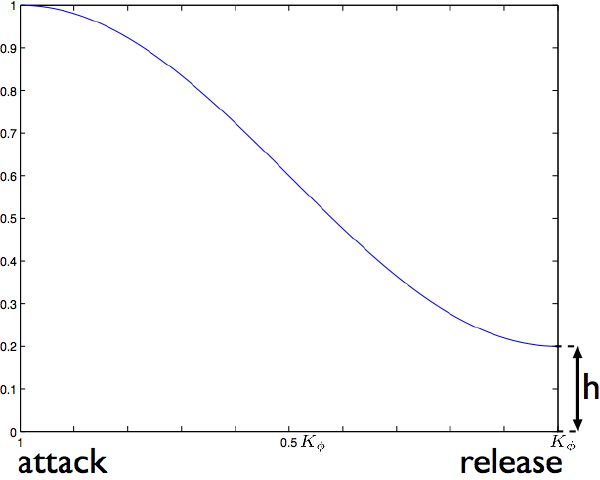
and mk is a path weight tuned according to the problem being solved as in Figure 4-4, or can be discarded: mk = 1 for k ∈ (1,Kφ).
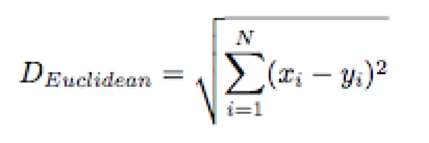
In a first task, we seek to measure the timbral similarity of the segments found through section 3.4 . A first approximation of D(T,R) consists of measuring the Euclidean distance (equation 4.5 ) between the 25-dimensional feature vectors proposed in section 3.7 . However, since timbre depends highly on temporal resolution, if we have access to the auditory spectrogram, a much more advanced solution is to time align the segments using dynamic time warping. In this case, d(ti,rj) is the distance between the 25-dimensional feature vectors of the auditory spectrogram, and D(T,R) is defined by the optimal path in the DTW algorithm (section 4.3 ). The Euclidean distance (equation 4.5 ), defined as the straight line distance between two points, should be appropriate since the auditory spectrogram is perceptually normalized, i.e., the geometric distance between segments is proportional to the perceptual distance, as defined psychoacoustically. It is computed for two points x = (x1,...,xN) and y = (y1,...,yN) in Euclidean N-space as:
| (4.5) |
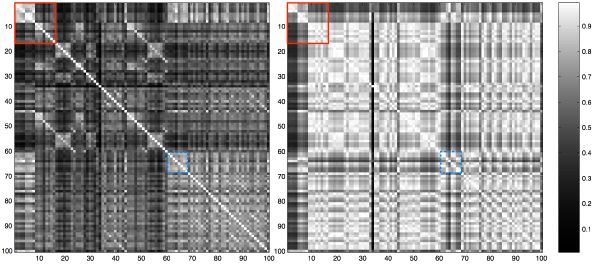
It was shown in [66] that attacks are more important than decays for timbre recognition. We dynamically weigh the path (parameter mk in equation 4.3) with a half-raised cosine function, as displayed in Figure 4-4, therefore increasing the alignment cost at the attack more than at the decay. Two parameters are chosen empirically (edit cost, and weight function value h), which could be optimized in future implementations. We compute the segment-synchronous self-similarity matrix of timbre as displayed in Figure 4-7 (top-right). Note that the structural information—visible in the frame-based self-similarity matrix—remains, although we are now looking at a much lower, yet musically informed analysis rate (a matrix size ratio of almost 1600 to 1).
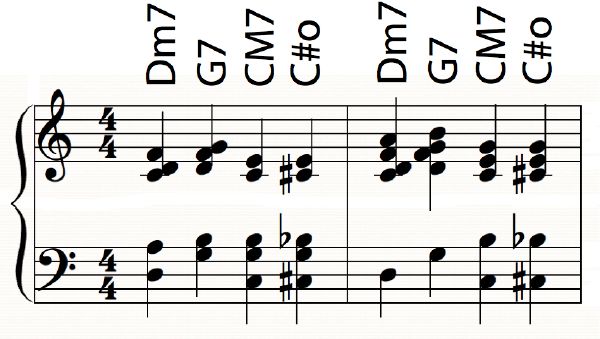
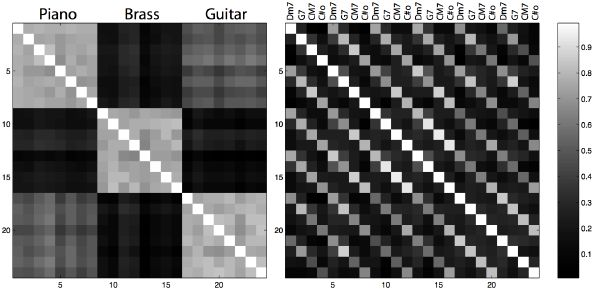
The pitch similarity of segments is computed directly by measuring the distance between chroma vectors, since it was shown that time resolution is not really an issue (section 3.6). We choose the Euclidean distance. However, here is a place to insert specific heuristics on the perceptual distance between chords: for example, CM7 may sound closer to Em7 than to C7 [93]. A simple example of decorrelating timbre from pitch content in segments is shown in Figure 4-6. Note how timbre boundaries are easily detected regardless of their pitch content, and how chord patterns are clearly identified, regardless of their timbre. Finally, the dynamic-loudness similarity of segments3 can be computed by DTW of the one-dimensional loudness curve.
|
|
|
|
|
|
The beat analysis (section 3.5) reveals the underlying musical metric on which sounds arrange. It is generally found between 2 to 5 segments per beat. Using the segment-synchronous self-similarity matrix of timbre as a new distance function d(ti,rj), we can repeat the DP procedure again, and infer a beat-synchronous self-similarity matrix of timbre. Although we do not consider it, here is a place to insert more heuristics, e.g., by weighting on-beat segments more than off -beat segments. Another option consists of computing the similarity of beats directly from the auditory spectrogram as in section 4.4, which is more costly.
It musically makes sense to consider pitch similarities at the beat level as well. We compute the beat-synchronous self-similarity matrix of pitch much like we do for timbre. Unlike sound-synchronous self-similarity matrices, beat-synchronous self-similarity matrices are perfectly normalized in time, regardless of their local tempo. This is very important in comparing music especially where tempos are not perfectly steady. Note in Figure 4-7 (bottom-left) that the much smaller matrix displays a series of upper/lower diagonals, which reveal the presence of musical patterns.
Beats can often be grouped into patterns, also referred to as meter and indicated by a symbol called a time signature in western notation (e.g., 3/4, 4/4, 12/8). This section, however, deals with patterns as perceived by humans, rather than their original score notation, as organized by measures.
A typical method for finding the length of a pattern consists of applying the autocorrelation function of the signal energy (here the loudness curve). This is a good approximation based on dynamic variations of amplitude (i.e., the rhythmic content), but it does not consider pitch or timbre variations. Our system computes pattern similarities from a short-term version of the beat-synchronous self-similarity matrices (only considering a limited section around the main diagonal), therefore it synchronizes the analysis to the beat.
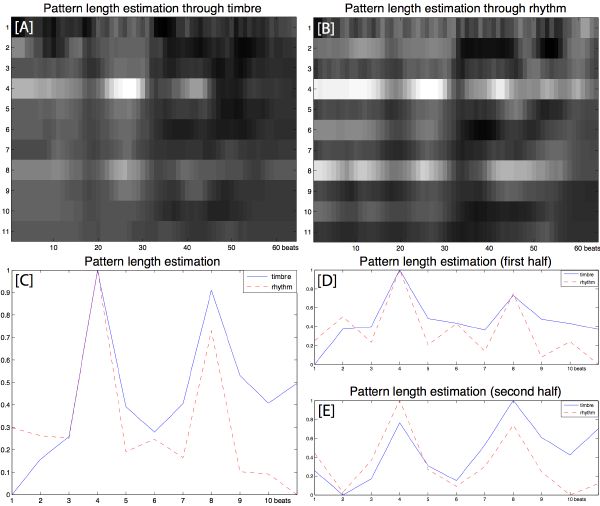
We run parallel tests on a beat basis, measuring the similarity between successive patterns of 1- to 11-beat long—typical patterns are 3, 4, 5, 6, or 8 beats long—much like our bank of oscillators with the beat tracker (section 3.5). We pick the first peak, which corresponds to a particular number of beats (Figure 4-8). Note that patterns in the pitch dimension, if they exist, could be of different lengths than those found in the timbre dimension or rhythm dimension. An example where only analyzing the pitch content can characterize the length of a pattern is shown in Figure 4-9. A complete model should include all representations, such that the length L of an ideal pattern is found as the first peak in a combination of all similarities. However, this is not currently implemented in our system: we choose timbre similarities for finding the pattern length.
|
|
A drawback of autocorrelation methods is that they do not return the phase information, i.e., where patterns begin. This problem of downbeat prediction is addressed in section 5.3 by taking advantage of our current multi-class representation, together with a training scheme. However, we now present a simpler heuristically based approach, generally quite reasonable with popular music.
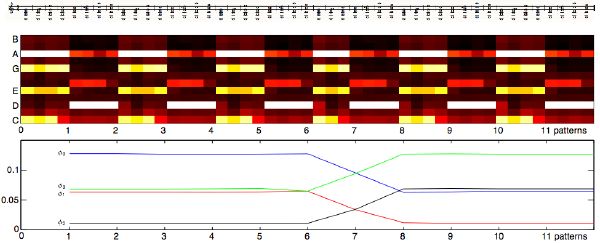
We assume that chord changes are most likely to occur on the downbeat as opposed to other beats: a fair assumption with most western music, typically annotated on a measure basis. We suppose that we already know the length L (in number of beats) of a pattern, as found in section 4.6.1. We define the dissimilarity D between two successive patterns by the Euclidean distance (equation 4.5) between their averaged chromas over L. For a given pattern i, the downbeat estimation consists of finding the maximum likelihood maxφDφj[i] in a set of L dissimilarity evaluations, i.e., for all beat phase φj, where 0 ≤ j ≤ L - 1.
If L can be divided by two, then it is likely that the minimum likelihood minφDφj[i] occurs at opposite phase ((φj + L∕2) mod L) compared to the maximum likelihood. Indeed, averaging chromas over two chords is more likely to minimize dissimilarities. Therefore, a more robust strategy first computes the absolute difference between pairs of dissimilarities in phase opposition, and chooses the best candidate (maximum likelihood) from the pair with highest absolute difference.
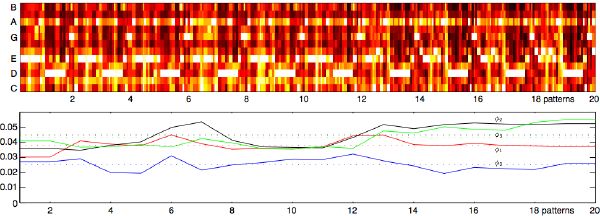
The process is causal, although it has a lag of 2L beats as demonstrated in Figure 4-9 for a simple synthesized example, and in Figure 4-10 for a real-world example. The lag can be completely removed through a general predictive model of downbeat prediction, as proposed in section 5.3. However, if real-time analysis is not a concern, then overall the present approach is statistically reasonable.
|
|
|
|
Finally, we derive the pattern-synchronous self-similarity matrix, again via dynamic programming. Here is a good place to insert more heuristics, such as the weight of strong beats versus weak beats. However, our current model does not assume any weighting. We implement pitch similarities from beat-synchronous chroma vectors, and rhythm similarities using the elaboration distance function proposed in [129], together with our loudness function. Results for an entire song can be found in Figure 4-11. Note that the elaboration distance function is not symmetric: a simple rhythmic pattern is considered more similar to a complex pattern than vice versa.
|
|
Several recent works have dealt with the question of thumbnailing [28], music summarization [132][30], or chorus detection [60]. These related topics all deal with the problem of extracting large non-periodic sections in music. As can be seen in Figure 4-7 (bottom-right), larger musical structures appear in the matrix of pattern self-similarities. As mentioned in section 4.2.4, advantages of our system in extracting large structures are 1) its invariance to tempo, and 2) segmentation is inherent to its representation: finding section boundaries is less of a concern as we do not rely on such resolution.
Although this is not currently implemented, previous techniques used for extracting large structures in music, such as the Gaussian-tapered “checkerboard” kernel in [30] or the pattern matching technique in [28], apply here, but at a much lower resolution, increasing greatly the computation speed, while preserving the temporal accuracy. Note that the pattern level is a fair assumption of section boundary in most popular music. In future work, we may consider combining the different class representations (i.e., pitch, rhythm, timbre) into a single “tunable” system for extracting large sections.
In this chapter, we propose a recursive multi-class (pitch, rhythm, timbre) approach to the structure analysis of acoustic similarities in popular music. Our representation is hierarchically organized, where each level is musically meaningful. Although fairly intensive computationally, our dynamic programming method is time-aware, causal, and flexible. Future work may include inserting and optimizing heuristics at various stages of the algorithm. Our representation may be useful for fast content retrieval (e.g., through vertical, rather than horizontal search—going down the tree structure towards the best similarity rather than testing all the leaves); improved song similarity architectures that include specific content considerations; and music synthesis, as described in chapter 6 .