The tools for synthetic biology have grown incredibly powerful: DNA synthesis, genome engineering, synthetic cells, directed evolution, cell-free systems, metabolic engineering, and nanomaterial science. However, these tools only cover the second half of the “read/write” cycle. In this class,
Evan Daugharthy and
George Church discussed the rationale for developing measurement technologies (“read”) to complement these engineering tools (“write”), so that we can understand the effects of our bioengineering efforts and make new products that resemble real biological systems.
Evan reviewed various approaches to molecular measurements, including DNA and RNA sequencing, proteomics, and 3D structural morphometry. The main focus of the class was in situ detection of single molecules (in situ is latin for “in place,” referring to detection of molecules inside cells). Finally, he discussed applications of these technologies to fibroblast wound healing, understanding how the brain works, and to developing new organoids to further our understanding of biological development and create new biomedical interventions to advance human health.

Computational: Analyze a FISSEQ dataset and find some in situ sequences
For the computational assignment, I followed the directions, with slight modifications to adapt to my computational environment (Mac OS X 10.11). Following is a brief overview of the workflow with answers to questions:
1. I downloaded and installed R, R studio, FIJI software w/ bio-formats plugin and Bowtie.
2. I downloaded the 2014 FISSEQ Nature files and the human reference RNA genome.
Note: The genome was not as a whole in the link provided, it was split in smaller size files and I had to assemble it using gunzip.
$ gunzip -c human.*.rna.fna.gz > human.rna.fna
3. I built the reference index using Bowtie (see Burrows-Wheeler transform)
$ bowtie-build -C -f human.rna.fna refseq_human
4. I registered the FISSEQ images using the following Matlab snippet:
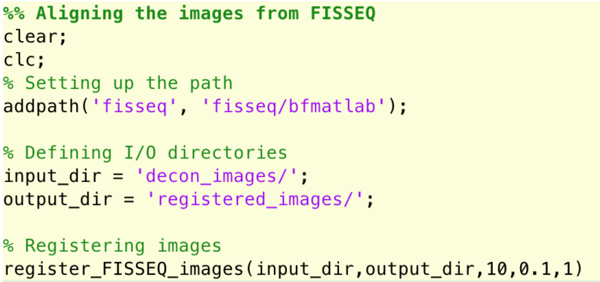
Question: What happens when you use different values for the parameters? How does it affect the image registration quality?
Setting the number of blocks per axis for local registration to different values increases or decreases the number of white spots (aligned spots) in the final image.
Setting the fraction overlap between neighboring blocks to low values is making the image less blurry.
Adjusting the alignment precision, of course, increases the quality of the output. Yet, with a high value the algorithm runs much faster!
5. I ran the following python script to generate base calls to the file read_data_2015_10_19_18_00.csfasta.
        import sys
        sys.path.insert(0,’fisseq’)
        import FISSEQ
        FISSEQ.ImageData(‘registered_images’, ‘.’, 6)
        quit()
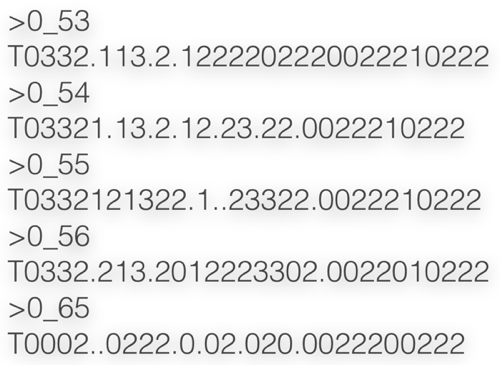
Question: Take a look at the reads in the resulting .csfasta file. How do they look? What happens to the number of reads if you change the value for maximum number of missing base calls ('6' in the command line).
As you can see in the following snippet of the reads file, each read is 32 bases long, and has from 1 to 6 gaps, as this was the maximum allowed. Changing the gap parameter to lower values decreases the number of reads and to higher it increases.
6. I then aligned the reads to the indexed reference human RNA genome using Bowtie. Mapped reads were written to bowtie_output.txt.
$ bowtie -C -n 3 -l 15 -e 240 -a -p 12 -m 20 --chunkmbs 200 -f -best –-strata –-refidx refseq_human
7. I spatially clustered the Bowtie reads to annotate clusters using gene2refseq, and wrote to results.tsv.
        import sys
        sys.path.insert(0,’fisseq’)
        import FISSEQ
        G = FISSEQ.ImageData(‘registered_images’, ‘.’, 6)
        FISSEQ.AlignmentData(‘bowtie_output.txt',3,G,'results.tsv',‘human.rna.fna’,'gene2refseq','9606')
        quit()
Question: Take a look at the output. What happens if you change the size of the kernel to something less than 3? To something much greater than 3?
If I change the value to something less than 3, there is no clustering! For something much greater than 3 (e.g. 7), the number of clusters is very small.
8. Lastly, I performed the analysis of FISSEQ data in R-Studio as instructed.
TODO: For the following tasks, I need more RAM !!!
Task: Are there any correlations between the features of FISSEQ clusters? E.g., is cluster size correlated with cluster quality?
Task: Find some clusters of different size and quality, and then look at the first image in Fiji and see if you can see the FISSEQ amplicon associated with that cluster. (Note: X/Y is inverted in the clustering file.)
Designing with In Situ Data
Were there any experiments in HTGAA so far, where in situ data of RNA, DNA, protein, or other cellular features would be helpful in understanding the engineering process?
I think FISSEQ would be really helpful to assess the activity of the cell-free TX-TL system we used in the second week with Kate Adamala. Have spatial and quantitative information about the location of the mRNA’s in the system, we will be able to analyze the transcription and translation rate, as well as test in a controlled environment other components such as splicing! Added Benefit: The cell is already dead !!
What are some reasons in situ data could be better than bulk data for this experiment? Try to think of cases where a bulk measurement would cause you to miss some insight.
In situ data is better as it can give you information about the local concentrations of mRNA’s in various positions along your tx-tl buffer. That information can be used to assess the dynamics of the protocol of cell-free expression,
What kinds of molecules would you like to detect? E.g. what species of RNA? How would you go about targeting those molecules?
I would like to detect mainly mRNAs to assess the splicing activity, as well as the rate of transcription/translation.
What factors would limit your ability to detect the things you are interested in?
I think that the major problem here would be to immobilize the RNA in situ, as you have no actual cell. I assume that the attachment protocol would work even with a liposome.
Experimental: Create an in situ sequencing library inside a polyacrylamide hydrogel, and detect the sequencing amplicons using fluorescent sequencing by hybridization