MAS.968
Cannes Data Analysis
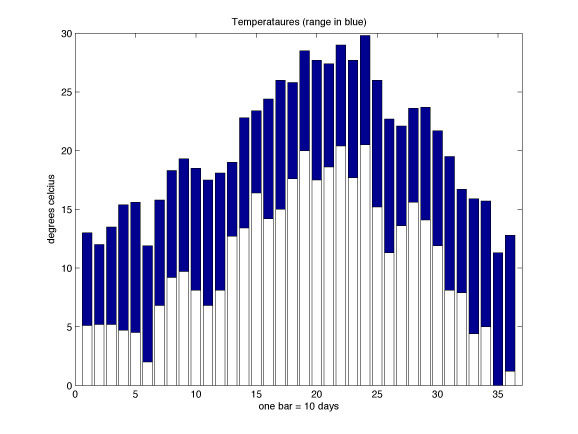
The graphs below include temperatures, rain, and garbage collection data obtained from the city of Cannes. Data is from one year only (2001 or 2002). Each graph represents a year. Each bar represents 10 days.

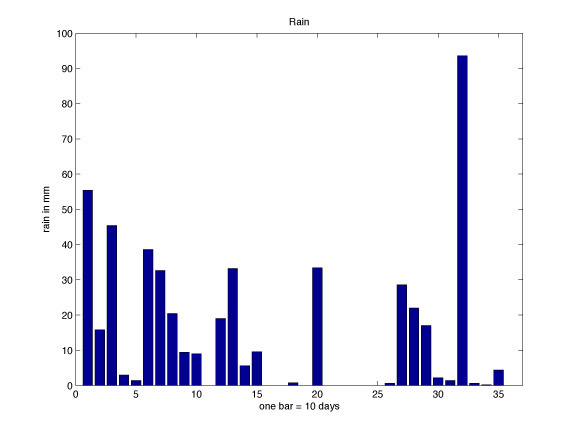
Not surprisingly, temperatures and garbage data correlate fairly well. Note that I represented the garbage data from 1,000,000 to 2,000,000 ( Kg I suppose), meaning that in mid-August (point 23), the amount of garbage is almost twice as much as during the beginning of November (point 31). The drop in the garbage data early October (points 26-28) marks the start of the new school year (tourists go home). The lowest point is also interestingly the rainiest time of the year (although the data isn't from the same year). The spike in May is certainly due to the film festival. Would the other spikes correlate with other conferences?