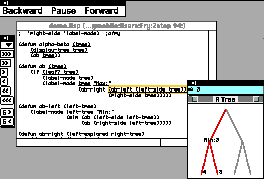
Please start by looking at page 2. You should look at it in page layout mode.
by
Henry Lieberman
MIT Media Laboratory
Christopher Fry
Harlequin, Ltd.
Introduction
ZStep 95 is a program debugging environment designed to help the programmer understand the correspondence between static program code and dynamic program execution. Some of ZStep 95's innovations include:
An animated view of program execution, using the very same display used to edit the source code
A window that displays values which follows the stepper's focus
An incrementally-generated complete history of program execution and output
"Video recorder" controls to run the program in forward and reverse directions and control the level of detail displayed
One-click access from graphical objects to the code that drew them
One-click access from expressions in the code to their values and graphical output
ZStep 95
Supporting the cognitive tasks in programming
Programming is the art of constructing a static description, the program code, of a dynamic process, the behavior which results from running the program. In that sense, it is analogous to composing music. The program code is like a musical score, whose purpose it is to cause the performer [in the programming case, a computer] to perform a set of actions over a period of time.
What makes programming cognitively difficult is that the programmer must imagine the dynamic process of execution while he or she is constructing the static description, just as a composer must "hear the piece" in his or her head, while composing. This puts a great burden on the programmer's short term memory. What makes programming even more difficult than composing is that a musical composition usually specifies a single performance, whereas a program may be executed in a wide variety of conditions, with different resulting behavior.
Many, if not most, non-syntactic program bugs result from a discrepancy between the programmer's imagining of the desired behavior in a given situation, and the actual behavior of the program code in that situation. [In the case of a design problem, the program may behave as "intended", but the problem may be that the original intention is wrong.]
Once program code is written, the problem remains of verifying that the code written actually expresses the programmer's intent under all circumstances of interest. Interactive tools such as debuggers and program visualization systems can be invaluable in bridging that gap. Instead of trying to imagine how the events in a program unfold over time, why not have the machine show them to you?
We have designed a program debugging environment
to explicitly support the problem solving methodology of matching
the expectations of a programmer concerning the behavior of code
to the actual behavior of the code. This environment is called
ZStep 95.
Problem solving processes in debugging: localization and instrumentation
Two principal activities in debugging that can be assisted by tools in the programming environment are instrumentation and localization. Instrumentation is the process of finding out what the behavior of a given piece of code is, the software analog of attaching oscilloscope probes to a hardware component. Traditional tools that assist instrumentation are trace, breakpoints, and manually inserted print statements: trace instruments all calls to a function, a breakpoint or print statement instruments a specific function call. The problem with using trace and breakpoints in debugging is that they require some plausible hypothesis as to where the bug might be, so you know where to place the instrumentation. They are not of much help when you have no idea where a bug might be, especially when there are too many possibilities to check individually.
Localization is the process of isolating which piece of code is "responsible" for some given undesirable behavior of a buggy program, without any prior knowledge of where it might be. Among traditional tools, a stepper is potentially the most effective localization tool, since it interactively imitates the action of the interpreter, and the program can in theory be stepped until the error is found.
However, traditional steppers have a fatal interface flaw: they have poor control over the level of detail shown. Since the programmer's time is too valuable to make looking at every single step of an evaluation feasible, only those details potentially relevant to locating the bug should be examined.
Traditional steppers stop before evaluation of each expression and let the user choose whether or not to see the internal details of the evaluation of the current expression. If the user chooses to see all of the details, they must wade through a lot of irrelevant information. On the other hand, if they attempt to speed up the process by skipping over [presumably working] code, they are likely to miss the precise location of the bug.
The user can't make the decision about whether to see the details of an expression if he or she doesn't know whether this expression contributes to the bug. This leaves the user in the same dilemma as the instrumentation tools -- they must have a reasonable hypothesis about where the bug might be before they can effectively use the debugging tools!
20-20 hindsight: Reversible control structure
The solution adopted by ZStep 95 is to provide a reversible control structure. It keeps a complete, incrementally generated history of the execution of the program and its output. The user can confidently choose to temporarily ignore the details of a particular expression, secure in the knowledge that if the expression later proves to be relevant, the stepper can be backed up to look at the details. Thus, ZStep 95 provides a true localization tool.
There has been a considerable amount of past work on reversible program execution [1,3,8,9,11,15], but this work has concentrated on the details of minimizing the space requirements of the history and tracking side effects to data structures, both of which are important, but secondary to the user interface aspects which are the emphasis of this paper. It is important not only to "back up" variables to their previous values, but also to "back up" a consistent view of the user interface, including static code, dynamic data, and graphical output so that the user "backs up" their mental image of the program execution.
The reversible control structure aspects of ZStep 95 are discussed in more detail in [9]. We will address the issue of the computational expense of the history-keeping mechanism later.
ZStep 95's main menu uses a bi-directional "video recorder" metaphor. The single-arrow "play" and "reverse" correspond to single-step in a traditional stepper, and the "fast-forward" and "rewind" operation go from an expression to its value and vice versa, without displaying details.
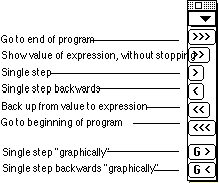
ZStep 95's "control menu"
It is important to note that ZStep 95's expression-by-expression stepping is not the same as statement-by-statement or line-by-line stepping found in many steppers for procedural languages. Individual lines or statements may still contain complex computations, and it is a severe limitation on the debugger if the granularity cannot be brought down finer than a statement or line.
The two "graphic step" operations G> and G< are an innovation that lets the user step the graphic output of the program back and forth, rather than control the stepper in terms of the expressions of the code. This will be discussed below.

ZStep 95's "cruise control"
ZStep 95 also has a "cruise control" mode,
in which the stepper can run continuously, in either direction,
without user intervention. The distance of the cursor from the
center of the panel controls the speed. The user can stop it at
any point when an interesting event appears, and run the stepper
in either direction at that point.
Keeping the debugging problem in context
A crucial problem in designing an interface for program debugging is maintaining the visual context. Because programming is an activity in which many items of interest have complex temporal and spatial relationships to other items, it is important to present each item with its context clearly identified.
Items such as the expression currently being evaluated, the value of a variable, or graphics drawn by the code may have almost no meaning outside their proper context. The programmer wants to know:
Where in the code was that expression was evaluated?
Which instance of the code was it?
When did the variable have that value
How did that graphic appear on the screen?
If the item and its visual context are spatially
or temporally separated, a new cognitive task is created for the
user -- matching up the item with its context. This new cognitive
task creates an obstacle for debugging and puts additional burden
on the user's short term memory. Linear steppers or tracers that
simply print out the next expression to be evaluated create the
task of matching up the expression printed to the place in the
code where that expression appears. "Follow the bouncing
ball" interfaces that point to an expression and print out
a value in another window lead to "ping-ponging" the
user's attention between the code display and the value display.
Follow the bouncing window
Because most programmers input their code as text
in a text editor, the primary mental image of the program becomes
the text editor's display of the code. Thus, to preserve the WYSIWYG
property, ZStep 95 always use the text editor's display to present
code during debugging.
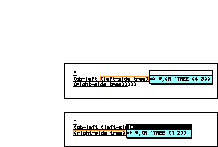
The value window moves through the code
To maintain visual continuity, it is important that the exact form of the user's input be preserved, including comments and formatting details, even if they are not semantically significant. As the interpreter's focus moves, the source code of the expression that is about to be evaluated, or has just returned a value, is highlighted.
Steppers always have the problem of how to show code
expressions and their values simultaneously. In ZStep 95, as the
editor's focus moves from expression to expression, we use a floating
window to display the value. The display of the value is always
exactly aligned with the expression to which it corresponds, so
that the visual association between an expression and its value
is obvious. The floating value window is colored light green to
indicate if the expression is about to be evaluated, light blue
to indicate a return value, or yellow if it has caused an error.
What did that code do?
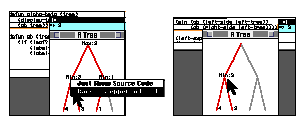
Our approach is to integrate instrumentation tools directly into the stepper. We provide two facilities for pointing at a piece of code and inquiring about the behavior of the code. Rather than inserting breakpoints or print statements into the actual code and resubmitting the code to the interpreter or compiler, we let the user simply point at the desired expression, then run the stepper until that expression is reached. This is called Step to Mouse Position. This is like a breakpoint, but an advantage is that the stepper is runnable both forward and backward from the point where the program stops, and all information about the computation remains available.
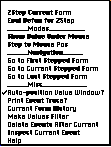
ZStep 94's pull-down menu
Even more dynamic is Show Value Under Mouse, which is like a continuously updated Step to Mouse Position. The user simply waves the mouse around the code, without clicking, and the expression currently underneath the cursor displays its value window.
What has that code done?
We also provide a facility to track the behavior
of a given expression over different execution histories. The
operation Current Form History allows the user to point
at an expression and bring up a menu of the past values of that
expression.
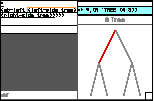
The history of values of an expression
Another history facility is the Values Filter, which brings up a menu of all returned values in the history satisfying a condition. Clicking on one of the values returns the stepper to the corresponding event. We could also provide a filter on the expression executed, which would correspond to a traditional trace.
ZStep 95 has a stack display that is updated continuously
with each event, animated in tandem with the source code animation.
Each stack frame is itself a menu item, and clicking it returns
you to that frame. All graphic display and other context is restored
exactly as it was when that stack frame was first entered.
What code did that?
One of the most essential, but also most difficult, tasks in debugging is being able to reason backward from the manifestation of some buggy behavior to the underlying cause. Even when the bug is visually apparent in the application's user interface, the programmer must work backwards from an incorrect display to the code responsible. Traditional tools do not make any special provision for debugging programs with graphic output; worse, the user interface of the debugger often interferes with the user interface of the target program itself, making it impossible to debug!
ZStep 95 maintains a correspondence between events
in the execution history and graphical output produced by the
current expression. Considerable care is taken to assure that
the graphic output always appears consistent with the state of
execution. When the stepper is run forward or backward to a certain
point in the execution, the graphic display is also moved to that
point.
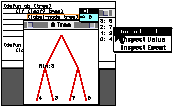
Clicking on a graphical object backs up the stepper to the event which drew it
Furthermore, individual graphical objects on the
display also are associated with the events that gave rise to
them. We allow the user to click on a graphical object, such as
a tree node in our example, and the stepper is automatically positioned
at the event which drew that node. Just as in our other operations
like Step to Mouse Position, the stepper is active at that point,
and the program can be run forward and backward from that point.
Let's see that again, slowly
In reasoning from the behavior of the program to the code, it is useful to be able to step the behavior rather than step the code. The user conceptualizes the behavior of the program as a set of graphic states that unfold over time, as the frames of an animation. The increments of execution should be measured in terms of the animation frames rather than execution of code, since events that happen in the code may or may not give rise to graphic output.
ZStep 95 provides two operations, Graphic Step
Forward and Graphic Step Backward, that run the stepper
forward or backward, respectively, until the next event happens
that results in significant graphic output. Below, each graphic
step results in an exploration of the next branch of the tree.
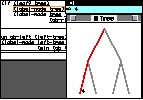
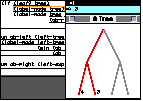
Three successive "graphic steps"
Each graphic step runs the stepper forward or backward until it is pointing at the event which was responsible for the graphic output, and the stepper remains live at all times. While stepping non-graphic code, the effects of previous graphic operations remain visible, just as they do in a normally-running program.
We could also provide graphic step operations analogous
to "graphic fast forward" and "graphic rewind".
Because the stepper can be run from either the code or the graphics
at any point in time, the user can easily move back and forth
between the different points of view.
Programming by Error Message
Trial and error is a tried and true strategy for solving all sorts of problems, but it's not a great strategy. It's inefficient, and can even be dangerous if the trial itself contains risks. It is the debugging strategy of last resort, but it is far better than having no strategy at all.
By understanding how trial and error works in debugging, we can provide support for this strategy in the programming environment. Interpretive environments, which let you perform the "edit, run, test" loop quickly, are one way to facilitate this rather dumb approach. Compiler warnings of traditional programming environments can also be quite useful, but they rarely pinpoint the expression that failed. .ZStep 95 implements several improvements that can drastically decrease the number of trials.
Traditionally, errors during program execution are disruptive. If you run some giant program and you get "error number -127" you have no idea which part of the program was responsible. Some environments put the user into a breakpoint loop, from which special commands can examine the error, and the stack can be inspected. In either case, errors disrupt execution and often lose information about partial computations which may have finished correctly.
Having an accurate mapping between the source code
and the error is crucial. In ZStep 95, an expression which results
in an error simply displays the error message in place of the
value of the subexpression most relevant to the error. The value
window is colored yellow to indicate the error condition. The
stepper remains active, all intermediate values are preserved,
and the program can be run backward to examine the history that
led up to the error.
Programming by Error Message
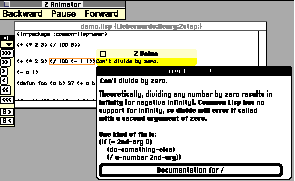
Let's use (/ 100 (- 1 1)) as an example program fragment. If an error occurs you'll see the expression highlighted, with a floating window containing the error message immediately to the right. We can back up to pinpoint the source of the error.
Now, we have confidence that we know just where the error is coming from, but we might not yet know how to fix it or how to avoid getting it in the future. If we ZStep forward to see "(/ 123 X) Can't divide by Zero" again, we can then click on "Can't divide by Zero" to get a dialog box with more information. This includes the full text of the error message, a brief explanation of the theory of the error [Dividing by zero would result in infinity and Common Lisp can't represent infinity], some examples of correct calls to the function "/" and perhaps some counter-examples. Finally you can click on a button to get additional documentation on the divide function itself.
Knowing exactly where an error occurred will often allow an experienced programmer to fix the bug. But a good error message can inform the inexperienced why it occurred, allowing them to not just fix the current error but to prevent creating such errors in the future. With really great error messages you can imagine knowing very little about a programming language and just start typing in code. Your first fragments will be syntactically incorrect and you'll be told why. After you've got the syntax down, you'll be getting semantic errors. These may require several levels of explanation that ultimately extend to the architecture of algorithms.
ZStep 95 facilitates the repair phase, since it leaves you in the text editor with the cursor pointing to exactly the code in need of repair. Further, you are then just one click away from restarting the entire computation after the edit. However, we cannot support restarting the computation from any point in ZStep's history after the edit, because editing a running program cannot guarantee consistency of the event data structures.
ZStep 95 has implemented support for only a tiny
number of such error messages. A complete system would support
all of the functions in the base language and let the programmer
easily enter in support for their own functions. To further the
"Programming by Error Message" concept, the documentation
for the function that errored [divide in our example] would contain
links to other arithmetic functions as well as descriptions of
the data types that they operate on, i.e. numbers. Extended examples
that contain calls to the function in question in context as
well as explanations of the algorithms being used would round
out the ideal "Programming by Error Message" environment.
Debugging the ZStep idea: Evolution from ZStep 84
ZStep 95 is an evolutionary descendant of steppers we have been working on since ZStep 84 [8]. We have been "debugging" the ZStep idea through informally testing different alternative interfaces and implementations. We present here just a few of the interesting aspects of ZStep 84's interface to illustrate some design alternatives.
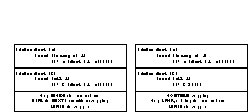
ZStep 84's interface: before (left) and after
(right) evaluating the expression (fact
(1- n))
ZStep 84 displayed code in two windows simultaneously. The top window contained an unmodified copy of the source code, annotated just by highlighting the current expression about to be evaluated or just evaluated. The bottom code window also showed the same code, but with the expressions replaced by their values as they are evaluated. In the right half of the illustration, the expression (fact (1- n)) is replaced by its value, 2.
Substituting a value for its expression has the advantage of being consistent with an intuitive "evaluation is substitution" conceptual model of the evaluation process, and also shows return values in their context. However, we prefer the single floating window approach, since it reduces the "ping-pong" effect of splitting the user's attention between two windows.
Instead of the "tape recorder" controls
of ZStep 95, ZStep 84 used a single menu, which dynamically changed
the names of the items depending on whether it was in the state
of just about to evaluate an expression or just about to return
a value. The current interface now uses color of the floating
window to indicate whether in an eval or a return state, and the
control button arrows are more intuitive than reading the names
of the operations.
Graphical representation of programs
There is no reason why we have to limit ourselves to textual representations of programs. In most of our implementations of ZStep, we have refrained from changing the physical appearance of program code, simply to keep the focus on debugging interfaces and not launch debates about visual programming. But we are sympathetic to the idea that graphical representations of program code might prove to be helpful in debugging. A graphical representation of programs, especially if it is animated as the stepper runs the code, might make bugs more visually apparent than by linearly reading program text.
We have done several experiments along these lines.
The illustration shows a program represented as a tree of function
calls, again with the values for expressions that have returned
a value substituted in place. Returned values are rendered in
a different color from program code expressions. The current execution
point is also displayed in a different color.
A function call tree representation of program code
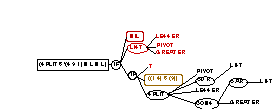
This function call graph is also animated by the stepper as the program runs, and can be seen simultaneously with a more conventional textual code display.

A 3D program representation
More radically, we have also worked on three-dimensional
animated representations of code [10]. This three-dimensional
representation uses boxes and other 3D forms to represent program
elements and smooth animation of program execution.
There's nothing slower than a program that doesn't work yet!
By now, many readers will be thinking: isn't all this history-keeping and use of special-purpose interpreters ridiculously expensive? Histories eat up enormous amounts of storage, and interpreting code is slow. The answer is: yes, it can be expensive. But does it matter?
First of all, we have to keep in mind that the purpose of the stepper is to debug programs that don't work yet, and so worrying about optimizing execution is silly. Even in an extremely large program, where keeping a complete history is infeasible, judicious testing can often isolate a fragement of the code which is not too large to run ZStep on. Nevertheless, we admit that there may be bugs that appear only after long runs involving large amounts of code, and so our techniques may be inappropriate in these cases. However, we conjecture that the vast majority of bugs are relatively shallow, and the productivity improvements from finding simple bugs quickly will far outweigh slower execution during testing.
Second, the key to making these techniques feasible over a wider range of programs are tools for selectively turning on and off history-keeping mechanisms. A simple way to automate selective processing of history in a common case would be to run the program normally until an error occurs. Then a program could use the stack inspector to determine what functions were involved in the error, and history-keeping would be turned on selectively for those functions. The problem would then be run again from the beginning.
Another common objection to our approach is that it is not guaranteed to work in the presence of programs that have side effects. First, we should observe that certain kinds of shallow side effects do in fact work without any special provisions. Incrementing a variable will, because of the history, preserve the values both before and after the operation. More complex side effects involving shared data structures will not work, but one is no worse off than with conventional debugging techniques. More elaborate history-keeping mechanisms such as those studied in the simulation literature could alleviate this problem.
A wonderful use of our stepper is in educational
applications, where execution efficiency is not of much concern,
but interactive control and data visualization are paramount.
One of the best ways to teach programming to a beginner would
be to have the student step through example programs. In general,
a stepper is an excellent tool for understanding code written
by others.
Implementation
ZStep 95 was implemented in Macintosh Common Lisp 2.0. It is a prototype, and not a production implementation in several respects. First, it works with only a subset of Common Lisp. Second, no attempt was made to optimize speed or space constraints. Third, we did not perform any formal user testing, besides getting feedback from both experienced and novice programmers. Our main goal was to experiment with novel interfaces to dynamic program visualization.
Adapting ZStep 95 concepts to C would be possible, but challenging. A complete parser and unparser for C syntax would be required and care would have to be taken to assure the C interpreter or compiler kept enough type and run-time information.
The lesson for design of languages and environments
is to consider debuggability as a primary criterion. If the goal
of a new environment is to make programmers more productive, nothing
could contribute to this goal more than introspective features
that provide the foundation for sophisticated debuggers.
Related work
We're sad to report that there is not as much related work in this area as there should be. Even recently implemented programming environments seem to provide only the same set of tools that have been around for the past 30 years: trace, breakpoints, stack inspection, and perhaps a line-by-line stepper.
The Transparent Prolog Machine [5] provides an innovative graphical view of program execution, and an interface carefully designed with Prolog's more complex execution model in mind. An innovative stepper for Lisp which shares some of the principles described here was recently implemented by Watt [14].
Many of the elements of our approach do have a long history. Reversible debuggers have been explored as far back as 1969 [3], and more recently by Moher [11]. However, these debuggers did not provide reversible animations of both the code and its graphical output, nor connections between individual code expressions, values and individual graphical objects.
The field of visual programming [7] uses graphical objects to represent the elements of the program, such as variables, functions and loops. The best of these environments also provide some animation of the graphical representation during execution. The pioneering work on animated visualization of program code in a single stepper was done by Ron Baecker [2].
Animation of visual representations of data manipulated by programs often appears under the name algorithm animation [4] [or scientific visualization if the algorithm represents a physical process]. Animations of data help a programmer visualize the dynamic effects of a program as it runs. But most visual programming and algorithm animation systems confine themselves to visualizing and animating either the code or the data, but not both.
No one of these approaches -- reversiblity, animation
of code, or animation of data -- by themselves will lead to a
satisfactory set of debugging tools. ZStep 95's contribution is
to integrate reversibility, animation of code, and correspondence
between code expressions, values and graphic output, all under
unified interactive control. Using the control structure of a
stepper to control visualization of data helps solve one of the
fundamental problems of software visualization: establishing the
correspondence between data that looks faulty and determining
the code that corresponds to the error. Adding data visualization
facilities to the code visualization that steppers provide solves
the problem of determining the effect of a particular piece of
code upon the [sometimes complex] program state.
Acknowledgments
Support for Lieberman's work comes in part from research
grants from Alenia Corp., Apple Computer, ARPA/JNIDS, the National
Science Foundation, and other sponsors of the MIT Media Lab, and
for Fry's work from Harlequin, Inc. The authors would like to
thank Marc Brown, John Stasko and Blaine Price, who ran the CHI
94 Workshop on Software Visualization, and John Domingue for
helpful suggestions.
References
[1] Hiralal Agrawal, Richard deMillo, and Eugene Spafford, An Execution-Backtracking Approach to Debugging, IEEE Software, May 1991.
[2] Ron Baecker, Two Systems Which Produce Animated Representations of the Execution of Computer Programs, SigCSE Bulletin, February 1975.
[3] Robert Balzer, EXDAMS, EXtensible Debugging and Monitoring System, Spring Joint Computer Conference, 1969.
[4] Marc Brown, Perspectives on Algorithm Animation, Proceedings of ACM CHI'88 Conference on Human Factors in Computing Systems, p. 33-38.
[5] Marc Eisenstadt and Mike Brayshaw, The Transparent Prolog Machine: An Execution Model and Graphical Debugger for Logic Programming, Journal of Logic Programming 5(4), p.1-66, 1988.
[6] W. Wayt Gibbs, Software's Chronic Crisis, Scientific American, Sept 1994.
[7] E.P. Glinert, ed, Visual Programming Environments: Applications and Issues, IEEE Press, 1991
[8] Henry Lieberman, Steps Toward Better Debugging Tools for Lisp, ACM Symposium on Lisp and Functional Programming, Austin, Texas, August 1984
[9] Henry Lieberman, Reversible Object-Oriented Interpreters, First European Conference on Object-Oriented Programming, Paris, France, Springer-Verlag, 1987.
[10] Henry Lieberman, A Three-Dimensional Representation for Program Execution, in [7]
[11] Thomas Moher, PROVIDE: A Process Visualization and Debugging Environment, IEEE Transactions on Software Engineering, Vol. 14, No. 6, June 1988.
[12] Donald Norman, Cognitive Engineering, in Donald Norman and Stephen Draper, eds. User Centered System Design, Lawrence Erlbaum Assoc. 1986.
[13] Dennie van Tassel, Program Style, Design, Efficiency, Debugging and Testing, Prentice-Hall, 1974
[14] Stewart Watt, Froglet: A Source-Level Stepper for Lisp, Human Cognition Research Laboratory, Open University, Milton Keynes, England, 1994.
[15] M. V. Zelkowitz, Reversible Execution, Communications of the ACM, Sept. 1973.