Conversation
Map:
A
Content-Based Usenet Newsgroup Browser
Warren
Sack
MIT
Media Laboratory
20
Ames Street, E15-120c
Cambridge,
MA 02139
wsack@media.mit.edu
ABSTRACT
The
Conversation Map system is a Usenet newsgroup browser that analyzes the text of
an archive of newsgroup messages and outputs a graphical interface that can be
used to search and read the messages of the archive. The system incorporates a
series of novel text analysis procedures that automatically computes (1) a set
of social networks detailing who is responding to and/or citing whom in the
newsgroup; (2) a set of “discussion themes” that are frequently
used in the newsgroup archive; and, (3) a set of semantic networks that
represent the main terms under discussion and some of their relationships to
one another. The text analysis procedures are written in the Perl programming
language. Their results are recorded as HTML, and the HTML is displayed with a
Java applet. With the Java-based graphical interface one can browse a set of
Usenet newsgroup articles according to who is “talking” to whom,
what they are “talking” about, and the central terms and possible
emergent metaphors of the conversation. In this paper it is argued that the
Conversation Map system is just one example of a new kind of content-based
browser that will combine the analysis powers of computational linguistics with
a graphical interface to allow network documents and messages to be viewed in
ways not possible with today's, existing, format-based browsers which do not
analyze the contents of the documents or messages.
Keywords
Content-based
browser, social network, social navigation, semantic network, semantic
navigation, graphical interface, spatial navigation, computational linguistics,
sociology
1. INTRODUCTION
Recent
advances in computational linguistics and quantitative sociology make it
possible to envision new designs for existing, network-based browsers and
clients (e.g., web browsers, news readers, email clients, etc.). These new
content-based browsers and clients will treat the contents of the messages and
documents displayed and not just their formats. Roughly speaking, these new
designs will incorporate the functionality of existing browsers together with
text analysis and information retrieval capabilities more sophisticated than
those now used in, for example, web-based search engines.
This
paper describes the design of a prototype Usenet newsgroup browser,
Conversation Map. The Conversation Map system employs a set of text analysis
procedures to produce a graphical interface. With the graphical interface one
can browse a set of Usenet newsgroup articles according to who is
“talking” to whom, what they are “talking” about, and
the central terms and possible emergent metaphors of the conversation. To
allow this combination of social and semantic navigation [5] the Conversation
Map system computes a social network (cf., [24]) corresponding to who is
replying to (or citing) whose messages. The Conversation Map system also
parses and analyzes the contents of the newsgroup articles to calculate a
semantic network (cf., [15]) that highlights frequently used terms that are
similar to one another in the Usenet newsgroup discussion. For example, if the
discussion includes messages concerning “time” and other messages
concerning “money” and these two terms (“time” and
“money”) are used in similar ways by the discussants (e.g.,
“You're wasting my time,” “You're wasting my money,”
“You need to budget your time,” “You need to budget your
money”) then the two terms will show up close to one another in the
graphically displayed semantic network and so indicate the presence of a
literal or metaphorical similarity between the terms (e.g., “Time is
money”). In addition, the Conversation Map system analyzes connections
between messages to extract an approximation of the discussion themes shared
between newsgroup participants.
The
output of the text analysis procedures are automatically translated into
interface devices that allow one to browse the Usenet newsgroup articles in
ways that would be impossible with a conventional, “format-based”
news reader (e.g., RN, Eudora, or Netscape). One of the purposes of this
research is to produce a better Usenet newsgroup browser for newsgroup
participants and others who might like a quick way of discovering the terms and
social structure of a newsgroup (e.g., sociologists and anthropologists of
on-line text and social activity). The text analysis procedures are
implemented in the Perl programming language and the graphical interface is
programmed in Java. The example of the Conversation Map interface to be
discussed in this paper can be found here: http://www.media.mit.edu/~wsack/CM.
Viewing the example Java interface requires a newer web browser (e.g., Netscape
>= version 4.5) and a operating system that supports Java 1.2 (e.g., Windows
or Linux).
This
paper is divided into three sections. The first section describes the
graphical interface of the Conversation Map system, the second sketches out the
text analysis procedures, and the third explains the Conversation Map system in
the context of related work.
2. THE
GRAPHICAL INTERFACE
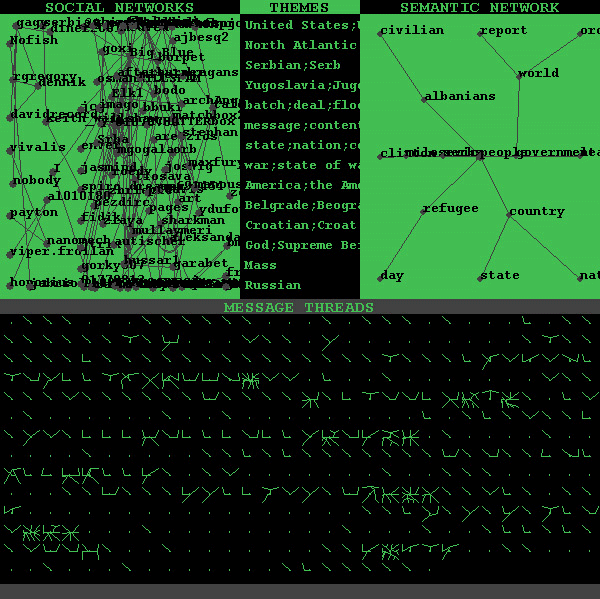
The
image shown below was produced by the Conversation Map system after an analysis
of over 1200 messages from the Usenet newsgroup soc.culture.albanian, a group
devoted to the discussion of Albanian culture in general, but at this period in
time (16 April 1999 - 4 May 1999) especially the war in Kosovo. The following
explanations of the interface will use images from the analysis of this
newsgroup as an example. However, it should be clear that this is only one
example. The Conversation Map system can be run on the message archive of any
newsgroup concerning any topic and will produce a unique interface image for
each and every newsgroup archive.
The
interface is divided in two pieces:
(1)
below the gray line labeled “message threads” is a graphical
representation of the newsgroup messages that have been analyzed by the
Conversation Map system;
(2)
above the gray line is a display of the three-part analysis: (a) social
networks; (b) discussion themes; and, (c) a semantic network.
All
parts of the interface are interconnected with the other parts of the
interface, so clicking on one part will highlight parts of it, but will also
highlight other parts of the interface too. To explain the parts and their
interconnections, each part of the image shown above will be explained..
2.1 Social
Networks
By
automatically identifying who has either responded to and/or quoted from whom,
the Conversation Map system calculates a social network given an archive of
Usenet newsgroup messages. The nodes in the network represent people -- i.e.,
participants in the online discussion -- and the links represent reciprocating
quotations and/or responses. Thus, if participant A responds to or quotes a
message from participant B and then, later in the discussion, participant B
quotes from or responds to a message from participant A, a link is drawn
between nodes labeled “A” and “B.” In the calculated
social networks, if A and B have reciprocated frequently, the link between them
will be shorter than if they have only quoted from or responded to one another
once or twice. By positioning the mouse over the social networks panel and
then pushing the right mouse button, the names labeling the nodes of the social
network can be turned off.
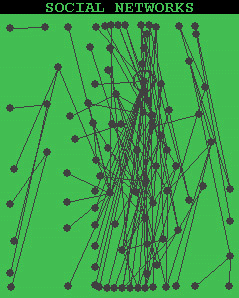
With
the names off, it becomes easier to see that some participants are central to
the newsgroup discussion and others are more marginal. The nodes with many
connections represent participants who are both responding to and being
responded to by many other participants. In other words, reciprocity is
highlighted in the computed social networks. The layout algorithm used tends
to push the central participants to the center. By simultaneously holding down
the Shift key and the mouse button one can drag the nodes of the social
networks around and get a better feel for the connectivity of various portions
of the networks.
To
turn the names labeling the nodes of the networks on again, press the right
mouse button again (or, simultaneously the Meta key and mouse button if you
have a one-button mouse).
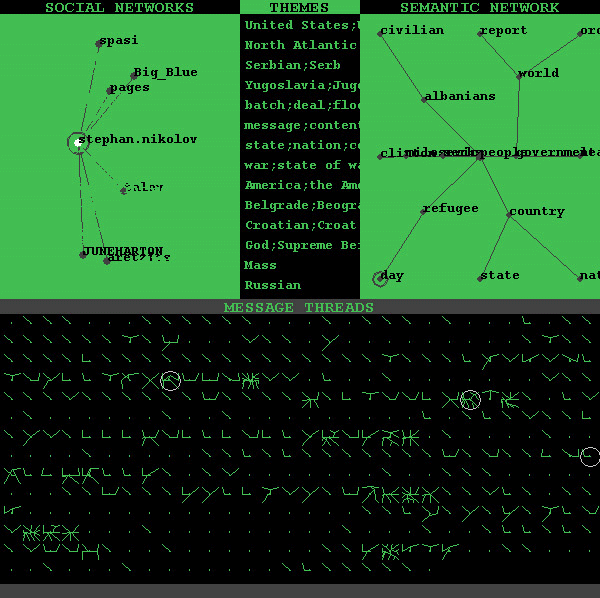
If
one clicks the mouse button over one of the nodes in the networks, a small
portion of a network is highlighted and the rest of the social networks
disappear. The node selected (representing one participant in the newsgroup)
and all the nodes linked to it are highlighted. At the same time, all of the
threads in the archive are highlighted (with a light gray oval) in which the
selected participant posted one or more messages.
By
holding down the Control key and simultaneously clicking the mouse button, a
second participant in the social networks can be selected. The edge between
the two selected participants is highlighted, the threads where the two
exchanged messages (and/or citations) are highlighted (in the case shown below,
only one thread is highlighted), and, also, the discussion themes apropos of
the messages exchanged by the pair are highlighted in the themes menu (in this
case, two themes are visibly highlighted: the posters sent messages and/or
quoted one another on the subject of the North Atlantic Treaty Organization
(NATO) and the subject of war).
To
make all of the social networks reappear, hold down the Alt key and click the
mouse button.
2.2 Discussion
Themes
If
participant A mentioned the word “baseball” in a post that also
quoted a part of a message from participant B wherein B wrote about the term
“football,” and then, later in the conversation participant B wrote
about basketball in response to a message by A concerning soccer, then the link
between A and B in the social network might be labeled with the term
“sports” since baseball, football, soccer, and basketball are all
sports. An analysis of discussion themes of this sort is done by the
Conversation Map system.
A
parenthetical note on “discussion themes”:
Strictly speaking -- i.e., according to the terminology of linguistics -- the
Conversation Map system does not identify discussion themes
per
se
,
but, rather, performs an analysis of lexical cohesion. Performing an analysis
of lexical cohesion is only one step of many that would be required if –
within linguistics -- it was to be claimed that the Conversation Map system
identified discussion themes. However, since an analysis of lexical cohesion
is a necessary step in the determination of discussion themes, we will call the
analysis an analysis of discussion themes for the sake of simplicity.
In
the interface, the results of the discussion theme analysis are displayed as a
menu of themes. When one clicks on the menu item “sports” the link
between A and B is highlighted (along with the links between any other pairs of
posters who are connected through a discussion of sports). We refer to this
combination of the social network and a discussion themes analysis as an
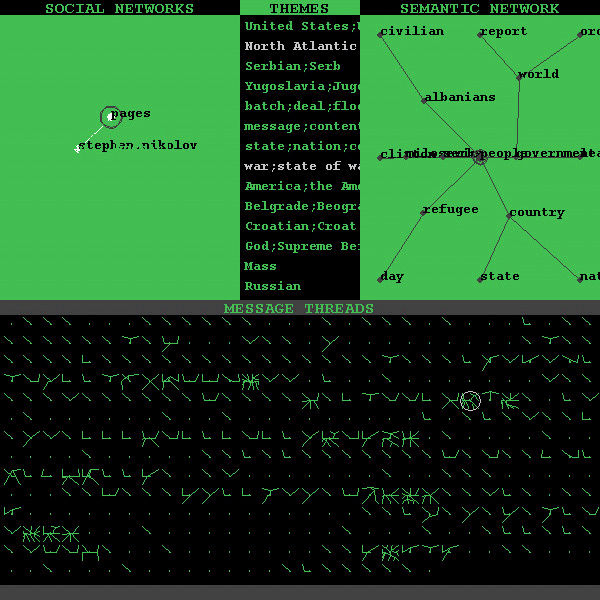
analysis of social cohesion [19]. Following is a picture of the same social
network shown in the previous figure along with the menu of discussion themes
that link messages, and thus, people together in conversation about the larger
topic of Kosovo and Albanian culture in general. The “NATO” item in
the themes menu has been highlighted by clicking on it with the mouse. The
figure shows which pairs of posters have exchanged messages concerning NATO.
Again, the unhighlighted portions of the social networks disappear from view
and the portions of the archive where NATO connects two or more messages
together are highlighted in the lower portion of the interface.
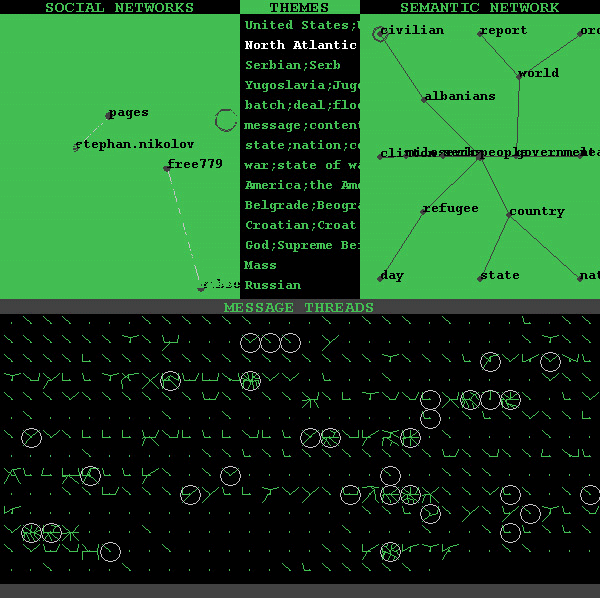
Note
that only two pairs of posters seem to have exchanged messages about NATO, but
many threads in the archive use NATO as a lexical tie between messages. It is
probably not the case that the four participants highlighted in the social
networks are responsible for all of the threads concerning NATO. Rather, it
must be kept in mind that a pair of posters is highlighted if and only if they
have a two-way, back-and-forth exchange involving a given theme while, in
contrast, the criteria for highlighting a thread in the archive is less
rigorous: a thread in the archive is highlighted for a given theme if the theme
connects even one pair of messages in the thread.
Themes
in the menu are listed according to the number of pairs of participants they
connect in the social network. Thus “United States” is listed
above “NATO” because “NATO” links only two pairs of
posters while “United States” links three pairs. All of the themes
down to “war; state of war; warfare” link two pairs;
“America; the Americas” links one pair as do the rest of the
following items in the menu.
Clicking
on a theme is equivalent to searching the message threads, but the search
performed differs from a conventional keyword search. A keyword search would
find, for instance, every mention of the term “NATO.” In contrast,
the theme search criteria are more rigorous. The theme search criteria are
only fulfilled if, for instance, “NATO” is mentioned in one message
of the thread and then again in a response or quoting message later in the
thread.
Multiple
themes can be selected by holding down the Control key while pushing the mouse
button. The menu can be scrolled down by simultaneously holding down the Shift
key and dragging the mouse. All highlighted themes can be simultaneously
unhighlighted by holding down the Alt key and clicking the mouse button.
2.3 The
Messages
Threads
in a newsgroup discussion consist of an initial message concerning some
subject, a set of responses to the initial message, a set of responses to the
responses, and so forth. Therefore, conceptually, a thread is a
“tree” in which the initial message is the "root" and links between
responses are the “branches” of the "tree." Graphically, a thread
tree can be plotted as a “spider web” in which the initial post is
placed in the middle, the responses to the initial post are plotted in a circle
around the initial post, the responses to the responses are plotted in a circle
around the responses, etc. One of the nice features of plotting the thread
trees as “spider webs” is that, at least in theory, any size tree
can be plotted within a given amount of space.
In
the bottom half of the figure below, over 400 threads are plotted as spider
webs constrained into rectangular (rather than circular) spaces. The threads
are arranged chronologically from upper-left to lower-right. By passing the
mouse over each thread, the start and end dates and the subject lines of each
thread can be read in turn in light gray text written into the dark gray strip
at the bottom of the interface.
Since
each thread is allotted the same amount of screen space, a rough guide to
newsgroup activity can be read off of the panel in which all of the threads are
plotted. If a thread without many messages is plotted, the rectangle
containing it in the panel appears as mostly black. Threads containing many
messages, and thus a lot of activity, appear very green.
In
the figure immediately above the threads in the archive where
“NATO” is a theme of discussion are highlighted. It can be seen
that the “NATO” theme is discussed in some of the busiest -- i.e.,
largest -- threads of the newsgroup archive.
In
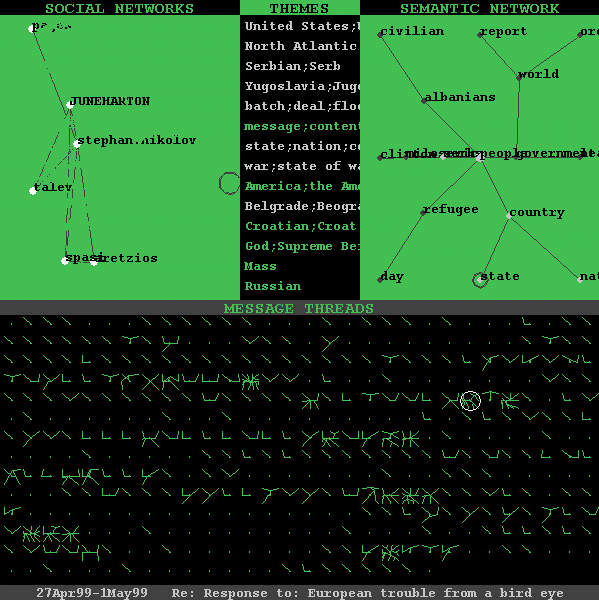
the figure below, one thread from the archive has been selected with a mouse
click. The thread selected has a white oval drawn around it. Note also that
the dates when the messages of the thread were posted (27 April 1999 - 1 May
1999) and the subject line of the first message in the thread is printed in the
dark gray strip at the bottom of the interface: “Re: Response to:
European trouble from a bird eye.” In addition, parts of the social
network, the themes menu, and the semantic network have also been highlighted.
In the social network, those participants who are part of the social networks
and who also have posted to the selected thread are highlighted. In the themes
menu, those themes which connect two or more messages in the selected thread
are highlighted. In the semantic network, those terms which correspond to the
highlighted themes are also highlighted. The connection between the themes and
the terms in the semantic network will be more fully explained in the section
below devoted to the semantic network.
2.4 Message
Threads
A
thread can be opened and explored by double-clicking on it with the mouse. A
double-click opens a separate window containing a larger version of the
graphical display of the thread. The following figure illustrates an opened
thread.
Normally,
the nodes of a thread (representing messages in the thread) would be labeled
with the names of the participants who posted them. In the figure above,
however, the names have been turned off (using the right mouse button or
Meta-click combination). In addition, some of the nodes of the thread have
been moved around (by holding down the Shift key and dragging the mouse).
The
spider web shape of the thread tree can be seen. If the thread was perfectly
balanced (i.e., if each message had exactly the same number of responses as
every other message), then the graphical plot of thread would more closely
resemble a symmetrical web. However, a symmetrical shape is more the exception
than the rule. The initial message of the thread is plotted as the largest
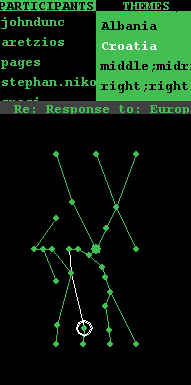
green node in the center. In the thread shown above, the discussion theme
“Croatia” has been highlighted. The menu of discussion themes can
be scrolled by holding down the Shift key and dragging the mouse. By clicking
on a discussion theme in the menu of themes, it is highlighted in white and the
portion of the thread in which it is used as a theme is also highlighted in
white. In this case, it can be seen that three of the messages of the thread
are connected together by the theme “Croatia.”
2.5 Message
Display
In
the thread shown above, a white circle around one of the nodes shows the
position of the mouse. If the mouse is clicked, the text of the message
(represented by the circled node) is displayed in a separate window.
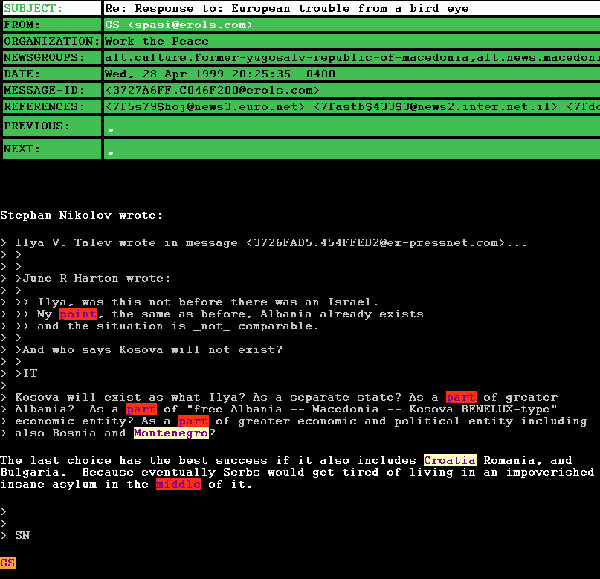
The
use of “Croatia” as a discussion theme that links two of the
messages of the thread is visible in the display of the message shown above.
“Montenegro” is mentioned in a quote from a previous message and
“Croatia” is discussed in the present message. The discussion
themes analysis procedure of the Conversation Map system connected these two
terms together because, in the thesaurus used in the Conversation Map system
(i.e., Wordnet version 1.6, [6]), Montenegro is listed as a part of Croatia.
The text of the message displayed above also illustrates two other features of
the Conversation Map system as a Usenet newsgroup browser: (1) Since
quotations within messages are identified as a part of the analysis procedure
for building the social networks, quotations within a given message are
automatically highlighted as hypertext within the display of the text of the
message. Clicking on the text of a quotation will open a new window containing
the full text of the quoted message. (2) Near the top of every message is a
PREVIOUS and a NEXT label. If there is a • symbol listed next to the
PREVIOUS label, clicking on the • will open a window containing the text
of the message that precedes the current message. A message, A, is said to
precede another message, B, if B is sent in reply to A. Since several messages
might be sent in reply to a message, one or more •s might appear after a
NEXT label. Click on each of the •s listed after the NEXT label to see
all of the messages sent in response to the current message.
2.6 Semantic
Network
The
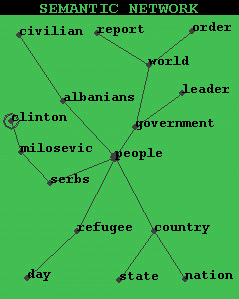
upper right-hand corner of the main screen of the interface displays a semantic
network. In the semantic network, if two terms are connected together, then
they have been calculated to have been “talked about” in similar
ways in the archive of newsgroup messages.
The
central terms of a discussion are often connected to two or more other terms.
Thus, in the soc.culture.albanian archive “people” is computed to
be a central, perhaps neutral, term is the vicious argumentation that
characterizes the content of many of the messages in the example archive. In
this archive Albanians are “talked about” as people, Serbs are
talked about as people, refugees are talked about as people, as are governments
and countries. In other words, it appears to be the case that all sides of the
argument (which is predominantly an argument pitting the Albanian view of the
Kosovo situation against the Serbian view) can agree that the more general term
“people” is applicable to both Serbs and Albanians.
The
graphical interface uses the same spider web algorithm to lay out the semantic
network as it uses to display the thread trees. Note that the algorithm
sometimes overlaps nodes of the graph. In the figure above, the nodes of the
semantic network have been rearranged for legibility by holding down the Shift
key and dragging the mouse.
Nodes
of the semantic network can be selected by clicking the mouse. For example, if
the term “country” is selected, all of the themes synonymous with
country are highlighted in the themes. Simultaneously, all of the participants
in the social network connected by the highlighted themes are also highlighted,
and all of the threads wherein “country,” or a synonym of country
is used as a discussion theme are also highlighted.
To
better understand why a given term appears where it does in the semantic
network, double click on the term to see all of the associations it has in the
archive of messages. Double-clicking on the term “country”
produces a web page containing the following information.
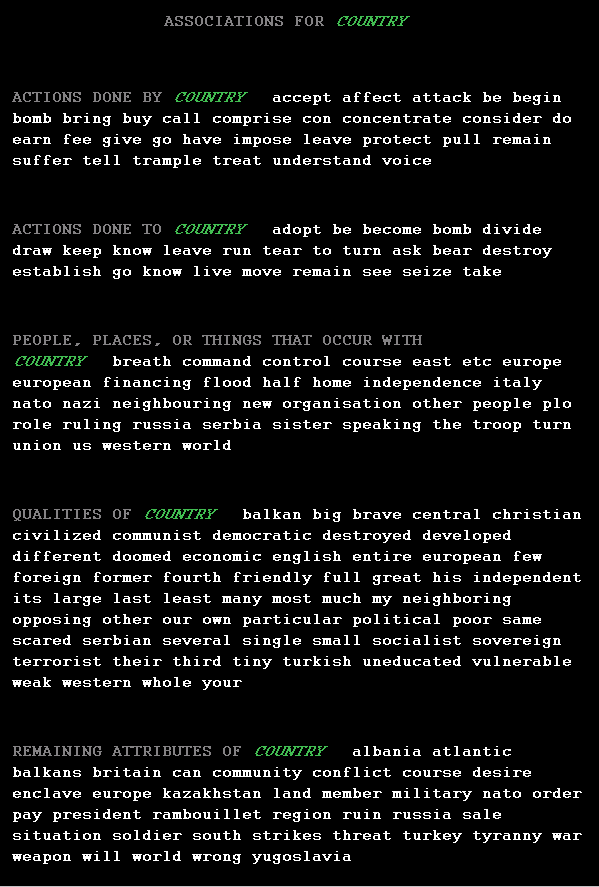
The
associations displayed in the image above were calculated by the Conversation
Map system. The Conversation Map system parses and analyzes the contents of
the newsgroup messages to calculate the semantic network. In the semantic
network, terms that are similar to one another in the newsgroup messages are
connected together by a line. To calculate which terms are similar to one
another, the Conversation Map system compares the list of associations for each
term against the list of associations of every other term. For example, if the
discussion includes messages concerning “time” and other messages
concerning “money” and these two terms (“time” and
“money”) are used in similar ways by the discussants (e.g.,
“You're wasting my time,” “You're wasting my money,”
“You need to budget your time,” “You need to budget your
money”) then the two terms will show up close to one another in the
graphically displayed semantic network and so indicate the presence of a
literal or metaphorical similarity between the terms (e.g., “Time is
money”). Specifically, two terms are “talked about” in
similar ways if they are often used with the same verbs, appear together with
the same nouns, and share a large number of adjectives with they are both
modified.
The
word associations that can be viewed by double-clicking on a term in the
semantic network is a complete list of the verbs, adjectives, and nouns that
are used with the given term. Each of the word associations can be
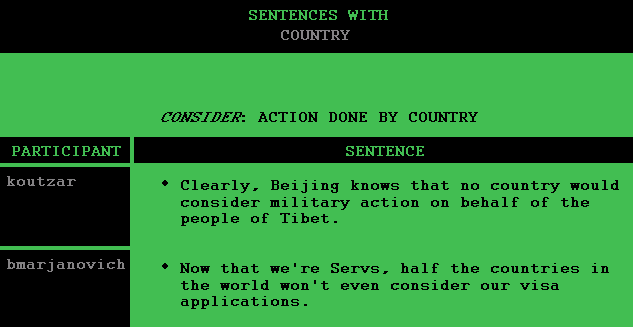
“opened” with a single click. If the verb "consider" is clicked on
from the display shown above, a web browser window containing the following
table appears. This table shows all of sentences in the archive of messages
where the term “country” has appeared as the subject of the verb
“consider.” To see the message that contains an example sentence,
click on the sentence and a new web browser window will be opened containing
the text of the message.
It
is also possible to compare the associations of one term with the associations
of another term. Return to the main window displaying the semantic network.
In the semantic network, hold down the Control key and click the mouse twice,
once over the term “country” and then over “nation.”
Now, hold down the Control key again and move the mouse over one of the two
selected terms, and double click the mouse.
A
new window is created. It displays the difference and union of the
associations for “country” and “nation.” Associations
unique to “country” are displayed in green. Associations unique to
“nation” are shown in silver. And, associations common to both
“country” and “nation” are written in white. Clicking
on any of the terms listed in green or silver will create a window of example
sentences like the window shown above for the examples of “country”
used as the subject of the verb “consider.” If any of the white
terms are clicked on, a similar window of examples will be created containing
sentences using the term “country” and other sentences using the
term “nation.”
By
comparing terms' intersecting associations it is possible to begin to explore
questions like these: In this conversation, how are countries like nations,
people like countries, or Serbs like Albanians?
3. THE
TEXT ANALYSIS PROCEDURE
The
analysis procedure of the Conversation Map system performs the following steps
on an archive of Usenet newsgroup messages in order to compute the social and
semantic networks described above:
(a)
Messages are “threaded.”
(b)
Quotations in the messages are identified and their sources (in other messages)
are found.
(c)
The “signatures” of posters are identified and distinguished from
the rest of the contents of each message.
(d)
An index of posters (i.e., newsgroup participants) to messages is built.
(e)
For every poster, the set of all other posters who replied to the poster -- or
quoted from messages authored by the poster -- is recorded. Posters who reply
to and/or quote from one another are linked together in the social network.
Reciprocity is therefore highlighted in the computed social network.
(f)
The words in the messages are divided into sentences, tagged with
part-of-speech information, and their roots are identified. To divide the
words into sentences, a tool built at the University of Pennsylvania is used
[18]. To accomplish the part-of-speech tagging, a simple trigram based
tagger has been constructed. The morphological analyzer built for the
Conversation Map system uses a freely-available morphology and syntax database
[12].
(g)
Discourse markers (e.g., connecting words like “if,”
“therefore,” “consequently,” etc.) are tagged in the
messages. The Conversation Map system employs a list of discourse markers
compiled by Daniel Marcu [13].
(h)
The sentences of the messages are parsed. The parser is a
re-implementation of the parser described in [7].
(i)
An analysis of lexical cohesion is performed on every pair of messages where a
pair consists of one message of a “thread” and another message that
either immediately follows the first message in the thread (i.e., is a reply to
the first message) and/or follows the first message in the thread and contains
a quotation from the first message. This analysis produces a series of lexical
ties between messages that can be understood as a crude approximation to the
theme of the conversation in a sequence of messages. The lexical database
WordNet [6] is used in the lexical cohesion procedure. See [8] for a
definition of lexical cohesion. See [10] for an example implementation of a
somewhat analogous lexical cohesion routine.
(j)
By using the index created in step (d) with the results of step (i) a set of
lexical ties are computed for every pair of posters who have replied to and/or
quoted from one another over the course of time represented by the Usenet
newsgroup archive under analysis. These aggregated lexical ties are layered on
top of the social network computed in step (e). The result is that most of the
links between pairs of posters are labeled with one or more lexical ties (i.e.,
one or more “discussion themes”). The combination of social
networks and lexical cohesion results is called
social
cohesion
. The social cohesion analysis procedure developed for the Conversation Map
system is partially described in [19].
(k)
The lexicosyntactic context of every noun in the archive is compared to the
lexicosyntactic context of every other noun in the archive. Nouns that
are used or discussed in the same manner are calculated to be similar and are
placed close to one another in the semantic network. An algorithm
similar to the one described in [7] is used. Once all of the noun-noun
pairs have been compared and a nearest neighbor for each noun computed, a
subset of the semantic networks computed are selected for display by ranking
the semantic networks. The top-ranked semantic network contains a set of
terms (used as “discussion themes”) that connect the greatest
number of poster pairs linked in step (j). In this manner, information about
the social networks of the newsgroup is used as a kind of “lens” to
select an important subset of the semantic information. Effectively, this type
of interlacing of the social and semantic information supports social and
semantic navigation [5] in the interface generated for the newsgroup.
4. RELATED
WORK
Several
other content-based Usenet newsgroup readers have been built with text analysis
procedures simpler than those incorporated into the Conversation Map system
discussed in this paper. For example, [11] describe an intelligent network
news reader that performs a sort of example-based, relevance feedback procedure
to select small collections of messages from an archive given an example
message. The intelligent network news reader also contains a method for
identifying sub-threads within larger threads by analyzing the content of the
messages in a thread [23]. However, systems of this sort (cf., [21]) are
mostly concerned with filtering messages rather than with one of the problems
addressed by the Conversation Map system: How can all of the messages in an
archive be graphically displayed and organized according to content of the
messages and the social structure representative of the participants'
interactions?
Many
of the computational techniques developed for the analysis of Usenet newsgroups
do not take the linguistic content of the messages into account at all using,
instead, exclusively information that can be garnered from the headers of the
messages; see, for example, [22]. Other work does employ some keyword spotting
techniques to identify and sort the messages into categories but does not
involve the analysis of grammatical or discourse structures; see, for instance,
[4].
Work
that does use the contents of the messages for analysis often does not take the
threading of the messages into account, or, if it does, does not pay attention
to the social network produced by newsgroup participants (e.g., [2]). Or, if
the work does take the threading and citation information into account it does
not necessarily use any of the linguistic contents of the messages to compute
the graphical display (cf., [3]).
Research
that has combined content analysis with an analysis of co-referencing of
messages and discussion participants has often employed non-computational means
to categorize the contents of messages (e.g., [1]). Some of the most
interesting work that analyzes message threading, participant interaction, and
the form and content of messages is often ethnographically-oriented,
sociolinguistic analyses of newsgroup interactions that is done without the
assistance of computers and is so, necessarily, based on a reading of only a
small handful of messages (e.g., [9]). Ideally one could program the computer
to emulate the latter sort of analysis, but that will require many advances in
the field of computational linguistics. What is unique to the text analysis
procedures of the Conversation Map system is the automatic construction and
combination of social and semantic networks that, together, provide a means for
exploring both the social and semantic structure of a Usenet newsgroup.
The
novel text analysis procedures in combination with a graphical interface make
the Conversation Map system an example of a new sort of content-based browser.
Earlier examples of content-based browsers (e.g., [17]) used simpler text
analysis procedures akin those employed in information retrieval systems. New
content-based browsers, clients, and readers (like the Conversation Map system)
will incorporate more sophisticated text analysis (and probably, eventually,
image analysis) techniques.
5. CONCLUSIONS
The
Conversation Map system is an attempt to construct a prototype, content-based
Usenet newsgroup browser that shows not only the terms being discussed but also
how the discussion conducted in the newsgroup constitutes a set of social
relations between participants. The text analysis procedures of the
Conversation Map system produce (1) a set of social networks; (2) a list of
high-frequency “discussion themes”; and, (3) a set of semantic
networks. These three results are displayed in a Java-based graphical
interface. Using this interface one can get a quick overview of some of the
social and semantic structures of the newsgroup discussion.
The
prototype system is being developed with two different groups of users in mind:
(1) The Conversation Map system could be used as a newsgroup reader by
newsgroup participants. This use would require that a newsgroup be archived
(as is done at sites like, for instance, www.dejanews.com) and the Conversation
Map system run periodically on the archive. The graphical interface of the
Conversation Map system would then provide newsgroup participants an
alternative way of reading the archive of past messages. (2) The Conversation
Map system is being developed in coordination with a small set of professional
users; i.e., anthropologists, sociologists, and others who are professional
discourse analysts interested in having a tool that provides them with a first
cut at their data. Specifically, the Conversation Map system allows them a
means to quickly overview thousands of newsgroup messages and so provides a
place to start doing closer readings of parts of the archive. One example
collaboration of this sort involves the anthropologist of science and
technology Joseph Dumit at MIT. Together we are attempting to use the
Conversation Map system to explore a set of newsgroups concerned with health
and medicine [20]. While the Conversation Map system is currently being used
as an archive interface by a small number of newsgroup participants, the
development, refinement, and evaluation of the Conversation Map system is
currently being accomplished more through a process of participatory design
with professional discourse analysts.
6. REFERENCES
[1]
Michael Berthold, Fay Sudweeks, Sid Newton, Richard Coyne. “It makes
sense: Using an autoassociative neural network to explore typicality in
computer mediated discussions” In F. Sudweeks, M. McLaughlin, and S.
Rafaeli (editors)
Network
and Netplay: Virtual Groups on the Internet
(Cambridge,
MA: AAAI/MIT Press, 1998)
[2]
M.L. Best. “Corporal ecologies and population fitness on the net.”
Journal
of Artificial Life
,
3(4), 1998.
[3]
Steve Cannon and Gong Szeto, Parasite, http://parasite.io360.com/index.html and
http://www.cybergeography.org/atlas/topology.html, 1998.
[4]
Judith Donath, Karrie Karahalios, and Fernanda Viegas “Visualizing
Conversations”
Proceedings
of HICSS-32
,
Maui, HI, January 5-8, 1999.
[5]
Paul Dourish and Matthew Chalmers. “Running Out of Space: Models of
Information Navigation.” Short paper presented at
HCI'94
(Glasgow, UK, 1994).
[6]
Christiane Fellbaum (editor)
WordNet:
An Electronic Lexical Database
(Cambridge, MA: MIT Press, 1998).
[7]
Gregory Grefenstette,
Explorations
in Automatic Thesaurus Discovery
(Boston: Kluwer Academic Publishers, 1994).
[8]
Michael A. K. Halliday and Ruqaiya Hasan.
Cohesion
in English
(New York: Longman, 1976).
[9]
Susan Herring, Deborah A. Johnson, Tamra DiBenedetto. “’This
discussion is going too far!’: Male resistance to female participation on
the Internet” In K. Hall and M. Bucholtz (editors)
Gender
Articulated: Language and the Socially Constructed Self
(New York: Routledge, 1995).
[10]
Graeme Hirst and David St-Onge. “Lexical Chains as Representations of
Context for the Detection and Correction of Malapropisms” in Christiane
Fellbaum (editor)
WordNet:
An Electronic Lexical Database
(Cambridge, MA: MIT Press, 1998).
[11]
Hitoshi Isahara and Hiromi Ozaku. “Intelligent Network News Reader”
In
Proceedings
of IUI'97
,
Orlando, FL, 1997.
[12]
Daniel Karp, Yves Schabes, Martin Zaidel, and Dania Egedi. “A Freely
Available Wide Coverage Morphological Analyzer for English” In
Proceedings
of COLING-92
,
1992.
[13]
Daniel Marcu.
The
Rhetorical Parsing, Summarization, and Generation of Natural Language Texts
,
Ph.D. Thesis (Toronto: Department of Computer Science, University of Toronto,
December 1997)
[14]
George Miller, “WordNet: A Lexical database for English”.
Communications
of the ACM
.
November 1995, 39-41.
[15]
M.R. Quillian “Semantic Memory” In M. Minsky (editor)
Semantic
Information Processing
(Cambridge, MA: MIT Press, 1968).
[16]
Sheizaf Rafaeli and Fay Sudweeks “Interactivity on the Nets” In F.
Sudweeks, M. McLaughlin, and S. Rafaeli (editors)
Network
and Netplay: Virtual Groups on the Internet
(Cambridge, MA: MIT Press/AAAI Press, 1998
[17]
Earl Rennison, “Galaxies of News: An Approach to Visualizing and
Understanding Expansive News Landscapes” In
Proceedings
of UIST'94
,
1994.
[18]
Jeffrey C. Reynar and Adwait Ratnaparkhi. “A Maximum Entropy Approach to
Identifying Sentence Boundaries” In
Proceedings
of the Fifth Conference on Applied Natural Language Processing
,
March 31-April 3, 1997. Washington, D.C.
[19]
Warren Sack “Diagrams of Social Cohesion” In
Descriptions
of Demonstrated Systems
,
Association
for Computational Linguistics, ACL’99
,
University of Maryland, College Park, June 1999.
[20]
Warren Sack and Joseph Dumit, "Very Large Scale On-Line Conversations and
Illness-based Social Movements," presented at the conference
Media
in Transition
,
MIT, Cambridge, MA, October 1999.
[21]
Beerud Sheth
NEWT:
A Learning Approach to Personalized Information Filtering
,
MIT Master's Thesis, 1993.
[22]
Marc Smith. “Netscan: Measuring and Mapping the Social Structure of
Usenet” Presented at the
17th
Annual International Sunbelt Social Network Conference
,
Bahia Resort Hotel, Mission Bay, San Diego, California, February 13-16, 1997.
[23]
Kiyotaka Uchimoto, Hiromi Ozaku, and Hitoshi Isahara. “A Method for
Identifying Topic-Changing Articles in Discussion-type Newsgroups within the
Intelligent Network News Reader HISHO” In
Proceedings
of Natural Language Processing Pacific Rim Symposium
,
Phuket, Thailand, December 2-4, 1997.
[24]
Stanley Wasserman and Joseph Galaskiewicz (editors)
Advances
in Social Network Analysis: Research in the Social and Behavioral Sciences
(Thousand Oaks, CA: Sage Publications, 1994).
